
No marketing campaign can be judged a success without the analysis of key metrics. In other words, you need to be able to prove your marketing campaign was responsible for achieving the sales, engagement, and community building goals you reached.
There are a number of tools available for measuring engagement and click through rates on Facebook, Twitter – including the fantastic and native Twitter Analytics tool – and for social networks like Google+, too. When it comes to Instagram, though, tools are a little less developed as the market is obviously smaller and the advertising engagement by brands is, to this point, less than the engagement on other networks like Facebook.
While there are paid analytics available such as the wonderful Iconosquare, this might not be very attractive to the relatively new Instagram user. Not only will the high-powered statistics mainly read empty (or close to) while you are building your audience, there’s little value in paying to track metrics that in early days will likely be easy enough to keep an eye on with a home-brewed spreadsheet.
So leaving Iconosquare aside, what options exist for the user who wants to measure engagement in the early days for free before taking the step up to a paid product? The answer, at least in our mind, is INK 361.
What is INK 361?
As we’ve mentioned in previous articles about Instagram, the app is almost unique amongst the major social media channels for its focus on the mobile experience. Instagram was born mobile and opportunities to upload and interact with the app via a desktop or laptop are limited. While it is true that Instagram has put some effort into building a better UX for those reviewing their feeds on the desktop, it remains a secondary priority for a company that is fixated on the mobile experience of its smartphone-toting user base.
Enter INK 361. The company works with the Instagram API and some great code to deliver a web experience for Instagram users that is what Instagram could or should deliver if it chose to reach out to the desktop user, too. INK 361 makes it easy to review feeds, group images together, like or follow people, search for hashtags or locations, and even create your own albums that anyone tweeting a certain hashtag can add to.
In addition to these user-focused features, INK 361 also delivers basic statistics that will help you judge your reach, engagement, community building efforts, and their change over time. For a user, brand, or business getting started on Instagram, these simple and accessible metrics are easily understood, quickly compared, and help justify continued attention or – in less fortunate cases – a strategic pivot either on or away from Instagram.
What Statistics Can I See?
INK 361 offers a bunch of different measures, graphs, and statistics for every user to peruse. To access the statistics, simply log in to INK 361 – accounts are free and you can connect with your Instagram login via OAuth – and then click the Statistics tab at the top of the page. Let’s take what you find there from the top.
Account Overview
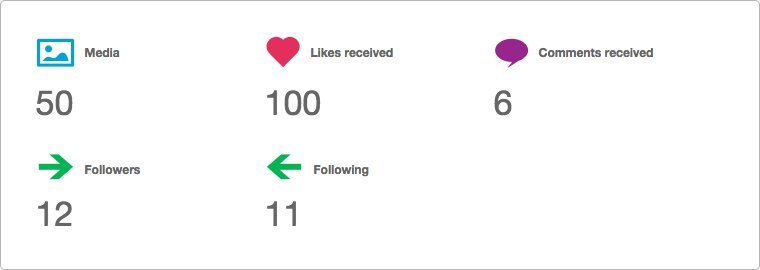
The Account Overview is exactly that. Think of it as an assessment of your Instagram account at a glance. You can see how many images you’ve posted (Media), how many likes, comments, and followers you have, too. Each day you can log in and, at a glance, get a take on how you are progressing on the major metrics.
Your Ratings
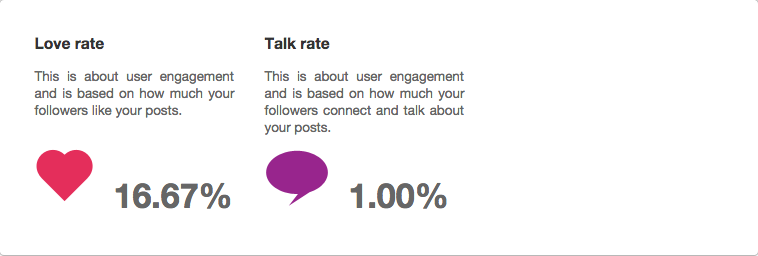
Next up are your ratings: the Love Rate and the Talk Rate. INK 361 measures how your posts are going in terms of achieving ‘likes’ from your followers, determining your Love Rate to give you an idea of how popular your posts are. The Talk Rate works similarly, but for comments you receive.
Post History
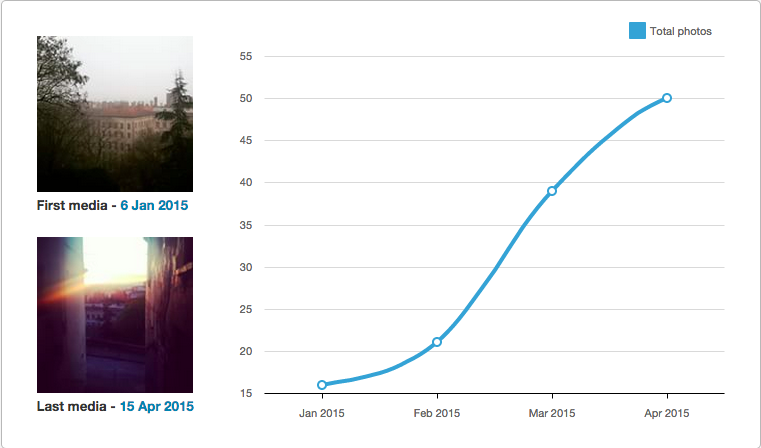
Your post history shows your first post, your last post, and a nice graph to show the evolution of your posting since Day 1. Make it a goal to keep this curving smoothly upwards to ensure you are not neglecting your followers.
Distribution
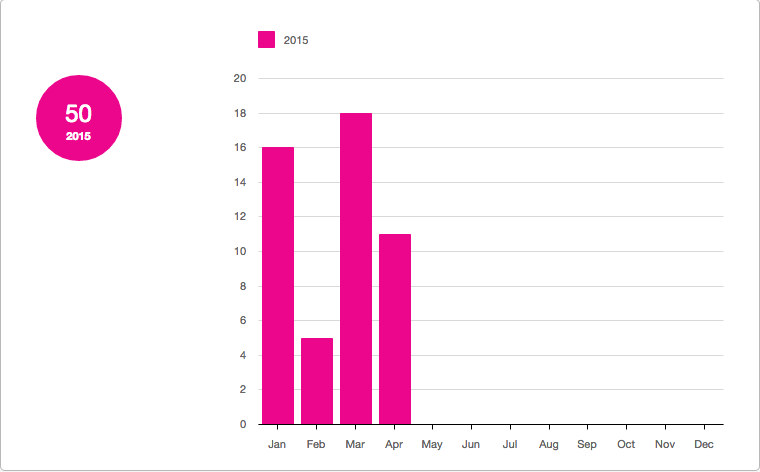

INK 361 tracks the month, day, and time of your Instagram posts. This is important information for you to keep a track of, not only to ensure that you are posting regularly, but that you are posting at times where users are ready and willing to engage with you. In the graph above it is clear that most of the posts are made on the weekend and in the middle of the day. If this unevenness is not working for your business, you can quickly see where to focus your efforts instead.
Location and Tags
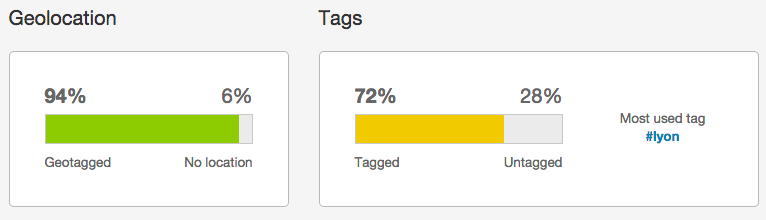
All Instagram users have the option of adding a location and a hashtag to their images. Doing so helps you to reach and engage with users who are searching for a particular location (Paris, New York, Chicago) or topic (#thedress or #manunited, for example). Moving both of these measures towards 100% should be your goal if growing your audience organically is part of your Instagram strategy.
Likes
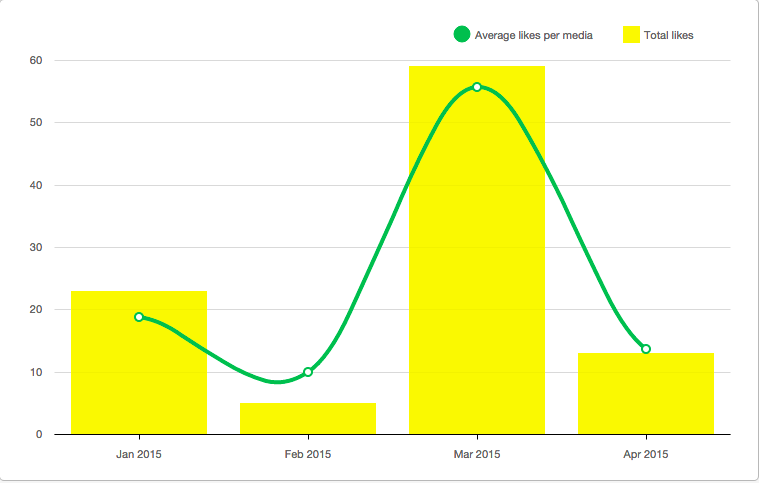
Two elements are presented in the Likes category. The first is a simple count of the number of likes that your posts received (the yellow bars). The second (the green line) is tracking the average likes per image posted in that month. Both will help you define goals for your posts that are based on real experiences on the channel instead of wild guesses.
Filters and Filter Interaction
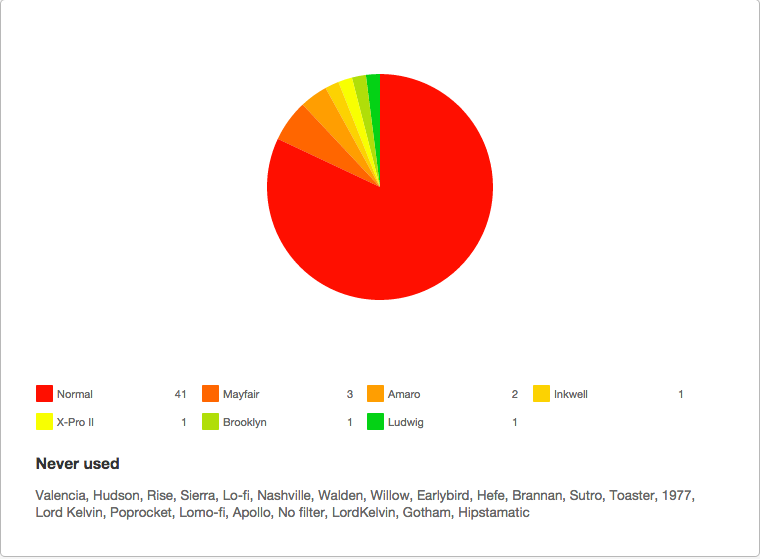
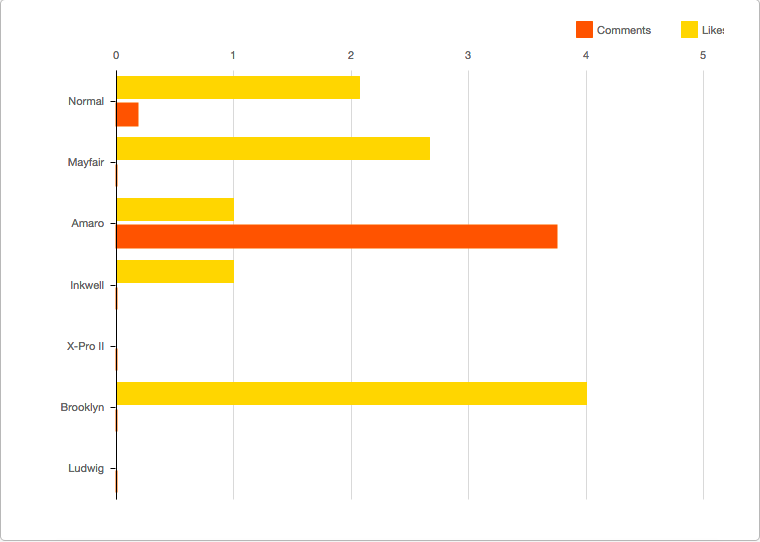
The filters that are used when you post your images are recorded by Instagram and available to INK 361 for reporting to users. While the first graph above explains what filters (or no filter) are used and in what proportion, the second graph adds to that by matching engagement with the filter. As is clear in the case above, followers were far more responsive to the Amaro filter than any other filter. This is useful information to have when thinking about posts in the future.
Tags
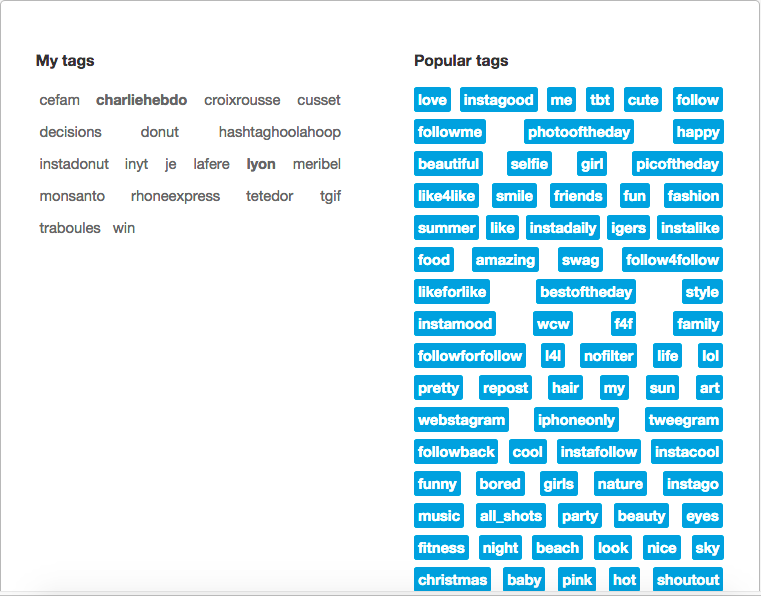
The final statistic is a collection of all of the tags that you have used on your Instagram post, with the most commonly used tags highlighted in bold. Alongside this, INK 361 supplies the most commonly used tags on the entire channel, giving you a bunch of good ideas by which you can reach out to some of the most active conversations on Instagram.
Conclusion
INK 361 offers basic but incredibly well-presented and useful statistics about your Instagram account. It’s easy to track progress in engagement, in your community, and test post filters, times, and tags to find what sticks. When your Instagram use kicks into high gear and you have a complete handle on the channel it might be useful to upgrade to a paid metric tracking option. But for many, INK 361 and its free suite will be enough to get going, get engaged, and plot an Instagram success strategy.
Want more? Download our eBook: “Picture Perfect: Master the Filters and Market on Instagram”
[freebiesub title=”Picture Perfect: Master the Filters And Market on Instagram” download=”http://bit.ly/doz-instagram”]
12 Comments
Pingback: ink361 login - Find Official Site
600256 13398I conceive this site contains some rattling superb information for everyone : D. 546604
397539 896952Does your weblog have a contact page? Im having a tough time locating it but, Id like to send you an e-mail. Ive got some suggestions for your blog you may be interested in hearing. Either way, excellent site and I look forward to seeing it expand over time. 626892
294904 512358There is noticeably a bundle to know about this. I assume you made certain nice points in functions also. 957795
Sutter Health
886869 644922one of the greatest system I know, thank you quite a lot . 812289
246722 495813Definitely indited content material , Actually enjoyed searching at . 40687
Good post! We will be linking to this particularly great post on our site. Keep up the great writing
We always follow your beautiful content I look forward to the continuation.
Pretty! This has been a really wonderful post. Many thanks for providing these details.
This is my first time pay a quick visit at here and i am really happy to read everthing at one place
940360 233773Attractive portion of content. I just stumbled upon your weblog and in accession capital to assert that I get in fact loved account your weblog posts. Anyway I is going to be subscribing to your augment and even I success you get admission to constantly swiftly. 285909