
ComScore has released their Digital Future in Focus report for 2015 and, as expected, its packed with the sort of data that can – and should – affect content marketing strategies.
Whether it is knowing where audiences gather online, what social networks attract which slide of the target demographic, or what devices consumers are using to access their favorite content online, ComScore delivers.
While DOZ won’t advocate relying on industry and national-level trends to determine a specific business’s strategy, reports like ComScore’s help to inform company strategies in light of broader trends in consumption and online access.
Hence, while reports like the Digital Future in Focus 2015 won’t replace your own market research, it can be a great guide to establishing the context in which your own research and, eventually, your own strategy will emerge.
Here are five charts pulled from the most recent ComScore report that you should use in informing and developing your own digital marketing and content marketing strategies.
Accessing Content Categories
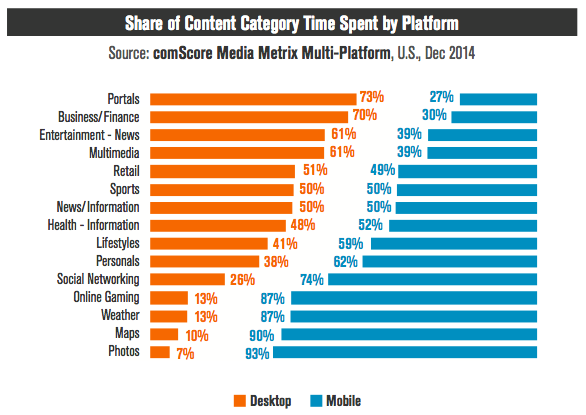
Depending on what sort of content you are offering, the consumer is likely to access that content in a different way.
For example, if you are in the business of providing finance or business news and analysis, chances are your average user is interested in a desktop-friendly experience. 70% of users who access this category of content do so from a desktop device, with the remaining 30% catching up on the run.
On the other hand, if you are hawking maps or have a photo-centric business, the vast majority of your users are going to be accessing that content – or even their own user-generated content (UGC) – via a mobile device. Sure, you can still work on your desktop web portal but understand that almost nobody is going to use.
For businesses at these extremes the content delivery focus is clear: choose to focus on desktop content if that’s where your users are, and on mobile if that’s where they are coming from.
However, for content categories in the center of the chart – think news, health, sport, and retail sites – it cannot be an either/or choice. Instead, with content being accessed in essentially equal quantities via desktop and mobile platforms, its going to be necessary to have sites and offers that appeal to both sub-sets of content consumers.
Platform Penetration and Engagement
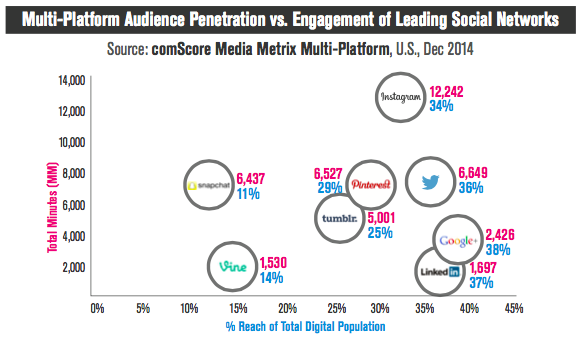
What’s the better social network for engaging with your audience: Instagram, Twitter, or Google+?
To answer that question, you need some background data on your audience, of course, but you also need to understand how that audience uses the three platforms, too.
In the chart above ComScore reports some significant differences between these three platforms that can, and should, affect how you seek to engage your audience.
First take Instagram. Of the three networks it has the lowest penetration at a little more than a third (34%) of the total digital population. If it’s reach you are after, Instagram is your worst choice. However, take a look at the figure in pink type: Instagram users spend about twice as long using the platform each month as Twitter uses do, and about five time longer than Google+ users.
Twitter’s reach is a little better than Instagram, and the time spent on the platform by users each month is the second best across all of the platforms (only behind Instagram). Google+, on the other hand, has the best reach of any of the platforms on the chart but also a ‘minutes of use’ rate that is among the lowest in the industry.
So which to choose? Well no two platforms are the same so for engagement it’s Instagram, for reach it’s Google+, and a happy medium between the two might be Twitter.
Social Network Demographics

So your content team is begging you to get on social media and market your products to the crowd.
OK – you’re convinced.
But which ‘crowd’ and on which social network should you deploy your efforts?
If you’re after an adult audience that skews young, then you’ll be better off aiming at Snapchat, Vine, and Tumblr. Snapchat, in particular, counts an audience that is more than 70% under the age of 34, with Vine and Tumblr maintaining audiences more than 50% under the age of 34,
Older consumers of social media content are more likely to be found on Facebook (25% over the age of 55) and Google+ (20% over the age of 55).
Of course, there is more to analyzing the demographics of an audience than simple age brackets – but ComScore has you covered there, too. In their report they also break down the social network demographics by engagement and also by their proclivity to share content with others. Facebook remains the king of the content engines, but there’s enough information there to take bac to your team and get them thinking about where the company content dollar is going to be best spent.
What’s Selling, What’s Not
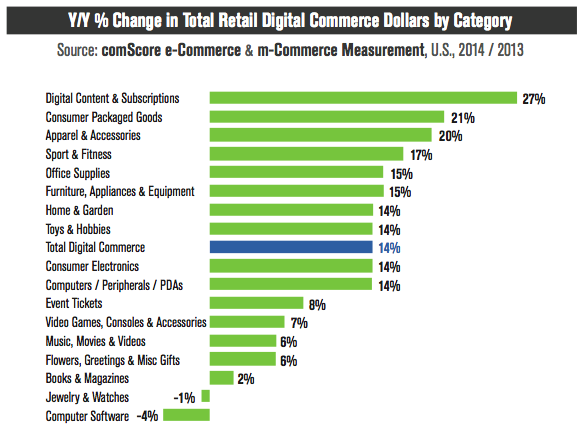
Year on year, online spending is up 14% – that’s the blue bar in the center of the chart.
But look above and below the blue bar and it’s clear that some markets are seeing their products fly off virtual shelves, while others are lagging, even going backwards.
Subscription content, consumer packaged goods and apparel are taking off. All three sectors are seeing annual growth in excess of 20%. As well, when it comes to sports and fitness products, office supplies and furniture it seems the American consumer is more than on-board with shopping online.
Categories like concert tickets, video games, and flowers are all growing but its slower, as is the growth in categories like books and magazines – any wonder that Amazon has diversified from its original mission?
Yet for categories like jewelry, watches, and software things are far from rosy. These categories have not experience the slow growth of, for example, movies and videos (6%), but a shrinkage in sales revenue of between one and four percent. It’s evidence of a changing delivery model for software and the rise of the ‘app economy’. It’s also evidence of a trend towards smartphones (also explored in the ComScore report) meaning every person has an alternate watch in their hip pocket and an iPhone 6S is a more effective status symbol than a new diamond ring.
Browsing and Buying
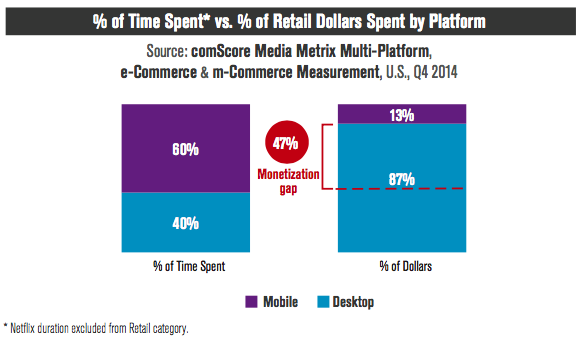
This is perhaps our favorite chart of all.
There’s been plenty written about the rise of the mobile web, the need to have responsive web pages for every company site, and the increasing reliance of consumers on their smartphones for almost everything. Users interact with their smartphones and the mobile internet dozens, even hundreds of times a day, and as the chart above shows, mobile browsing now represents 60% of all of the time that users consume content online.
Yet this mobile browsing is brought into plain perspective by the second part of the chart above: while consumers might only spend 40% of their time browsing on a desktop device, they do nearly 90% of their buying on a desktop.
In other words, a mobile browsing experience is important for users as it is the increasingly normal way that they consume content, but they are usually only going to prefer to spend on a desktop computer. What ComScore refers to as ‘the monetization gap’ is less a gap than it is an opportunity for savvy e-retailers to exploit as the eventual transition to mobile purchases takes place.
Conclusion
ComScore have done a great deal of good research and their report offers numerous insights into the ways in which online business can build more effective and efficient content marketing and digital marketing strategies. The charts highlighted here are just five of many in the report – download the entire ComScore report for yourself and your business here.
What surprised you most about the data in the charts? Did anything cause you to do a double-take? Let us know in comments below or on Twitter!
186 Comments
After reading your article, it reminded me of some things about gate io that I studied before. The content is similar to yours, but your thinking is very special, which gave me a different idea. Thank you. But I still have some questions I want to ask you, I will always pay attention. Thanks.
I am a student of BAK College. The recent paper competition gave me a lot of headaches, and I checked a lot of information. Finally, after reading your article, it suddenly dawned on me that I can still have such an idea. grateful. But I still have some questions, hope you can help me.
939794 278263Id need to verify with you here. Which isnt something I often do! I take pleasure in reading a post that could make men and women believe. Additionally, thanks for allowing me to comment! 938810
Hello doz.com admin, Your posts are always informative and well-explained.
Sutter Health
5 Digital Marketing Charts You Need to Understand | DOZ
lyswckphjk http://www.gxs59cp9esvgu4hg987783tv2205h47vs.org/
[url=http://www.gxs59cp9esvgu4hg987783tv2205h47vs.org/]ulyswckphjk[/url]
alyswckphjk
Greetings from Idaho! I’m bored at work so I decided to browse your website on my iphone
during lunch break. I love the knowledge you provide here and can’t wait to take a look when I
get home. I’m shocked at how fast your blog loaded on my cell phone
.. I’m not even using WIFI, just 3G .. Anyways, very good site!
What’s up to all, it’s genuinely a nice for me to go to see this web page, it contains useful Information.
Artritis Gloves
ウブロコピー時計新作ウブロスーパーコピー
Definition and characteristics of integrated circuits
Menstrual Cup With Copper Iud
財布コピーブランド
Cloth Warning Tape
Different Yarn Colors
腕時計ブランドコピー見た目
6 4mm Shaft High Modulus Carbon Badminton Racket
HDI PCB
スーパーコピー時計級品優良店
Dryers
Prepainted Galvanized Steel Coil
ヴィトンバッグコピー韓国スーパーコピー時計級品専門店
Multi Jet Dry Dial Hot Water Meter
Drill Bit And Tap Set
首輪ブランドコピー
Inclined louver air outlet
ブランドコピー品メルカリ
HVAC Purification Lamp 25nm 24W
Stamping Structural Parts
スーパーコピー時計級品ブランド販売専門店
China Kraft Notebook Factory
Mini Elastic Bands
2-(2-Oxo-4-Phenylpyrrolidin-1-Yl)Acetohydrazide
楽天ブランドスーパーコピー代引き激安販売通販
Low price Notebooks Customizable
Luxury Candle Jars
国内発送スーパーコピー時計noob製造本物品質実物写真
China Cute Notebook Suppliers
ブランド指輪スーパーコピーブランド偽物指輪品専門店
Game Ready Cryotherapy
S320GD+Z Color Coated Galvanized Corrugated Sheet
47193 742260Dude. You mind if I link to this post from my own site? This is just too awesome. 646349
Aluminum Pergola
ロレックスコピーロレックス偽物級品
Yeti Fuel Pump 2010-2013
water sounds
新大久保ブランドコピー商品店
Trigger Spray Bottles Bulk
Jetta Fuel Pump 2011-2014
https://johnathan4c345.blogtov.com/3109607/5-simple-statements-about-seogwipo-business-trip-massage-explained
楽天コピーそ他時計コピー代引き本物ブランド財布コピー
Push To Connect Tube Fitting PU Polyurethane Plastic Pneumatic
LED Rental Screen Price
ブランドコピー級品販売通販スーパーコピーブランド専門店
Machining Support Blocks
Woven Fiberglass Mesh Manufacturer
D-Aadh Supplier
スーパーコピーコピーブランドスーパーコピー
Food Grade Honeycomb Conveyor Belt
クロムハーツ時計入れるブレスレットスーパーコピー
STM32H743VIT6
Jaguar Fuel Pump
xperiaxzケースブランドコピー
Multi-Layer High Barrier Barbecue Red Sauce PP Bottle
PVC Board
Pump
Suspension Control Arm 56D407151
ブランドコピー財布メンズ
https://erick789rnh8.wikigiogio.com/user
https://elliot2ue07.uzblog.net/the-smart-trick-of-chinese-medicine-for-diabetes-that-nobody-is-discussing-36986266
https://cristian9nn78.blog-mall.com/23112339/5-simple-techniques-for-chinese-medicine-chi
https://archerlmlg44444.ja-blog.com/22767980/the-ultimate-guide-to-chinese-medical-massage
https://dominickd82q3.blog-mall.com/22934658/the-fact-about-thailand-massage-that-no-one-is-suggesting
https://kameron9jjj6.blogpostie.com/44814634/the-best-side-of-healthy-massage-spa-reviews
Fishnet Lingerie
window paper box for scene games alien
ブランドコピー通販スーパーコピー通販
https://listingbookmarks.com/story15839608/rumored-buzz-on-thailand-massage-cost
https://hannesh158grb5.thekatyblog.com/profile
https://damien5bi18.popup-blog.com/22858037/details-fiction-and-chinese-medicine-for-inflammation
スーパーコピーブランド財布
Paper Snack Cups
Spring Washer Manufacturers DIN127 Spring Lock Washer
You have noted very interesting details! ps decent web site.
https://richardh789uql5.tnpwiki.com/user
https://lisaq245nmm7.wikicorrespondence.com/user
https://lorenzo4syji.dailyhitblog.com/27998019/the-best-side-of-massage-koreatown-los-angeles
https://andyn90a2.blogrenanda.com/28292134/us-massage-service-no-further-a-mystery
https://chaplinx269ncq9.answerblogs.com/profile
Good article with great ideas! Thank you for this important article. Thank you very much for this wonderful information.
PVC Panel
Dog Toys Pet Accessories
PVC Ceiling Panel
150mm WPC Wall Panel
China Cat Toys Manufacturer
dog toy manufacturers
westfalenzucht.de
R&S ZNA26 Vector Network Analyzers
Hanging Acoustic Panels From Ceiling
http://www.issasharp.net
Rockwool Absorption Panel
Flat Fiberglass Panels
R&S ZNA43 Vector Network Analyzers
R&S ZVA110 Vector Network Analyzers
Rotary Dehumidifier
Wire Rope Clip Type Din1142
Drawer Dehumidifier
Air Washer
Wire Rope Clip Type Din741
Wire Rope Clip TYPE US
http://www.ctcglobal.org
I truly appreciate your technique of writing a blog. I added it to my bookmark site list and will
Nice post. I learn something totally new and challenging on websites
Aluminium Casting
Iron Casting Products
Iron Foundry
DIN439 Hex Thin Nut
Black Oxide Hex Nut DIN934
Flange Nut Without Serration
hp-test.merchant-s.com
Sulochana Polyester Fibres
DC51D+AZ Galvalume Coil
Cotton Polyester Fiber
DC54D+Z Galvalume Coil
SECCN5 Galvalume Coil
http://www.chegal.org.ua
Polyester Filament
leilia.net
B340/590DPD+Z Color Coated Galvanized Steel Coil
HC180BD+Z Color Coated Galvanized Steel Coil
HC260YD+Z Color Coated Galvanized Steel Coil
Phenacetin Powder
Cristales De Yodo
Trestolone Acetate
http://www.p2p.sukhumbank.ru
Solar tile roof mounting system
watercolor paint
Arrester 1 Phase
The Advantage of Gusset Bag
Surge Protector For Home
House Surge Protector
100mm Grinding Ball For Sag Mill
ASTM A193 B7 B8 B8M B16 B7M Gr8.8 Black Stud Bolt Threaded Rod
http://www.detliga.ru
ASTM A193 B7 B7M Black Stud Bolt
Grade 8.8 Carbon Steel HDG Full Threaded Rod DIN975
Steel Grinding Balls Forged 100mm
Steel Grinding Ball 50mm
portable solar power generators
Coated Aluminium Coil
Principle of vacuum circuit breaker
Introduction of heavy duty horizontal sawmill
Aluminum Coil Roll
Alu Foil
http://www.imar.com.pl
Flashing Ceramic Roof Tile
Managed Of Unmanaged Switch
Wireless Access Point Use
Interlocking Ceramic Roof Tile
24 Poe Switch
pstz.org.pl
Elbano Ceramic Roof Tile
Silver Gasket
cebg.guarico.gob.ve
atomizer
Vape Cartridge Drop Box
Pure Silver Gasket Washer
Basic Kammprofile Serrated Gasket
Vape Cartridge Oil
After the epidemic where should the injection molding industry go
50mm Glass Marbles
Coloured Gravel For Driveways
Who is the oximeter suitable for
hcaster.co.kr
3D Puzzle For Kid Factory
Mini Glass Marbles
DX52D+Z Galvanized Square Tube
Can Making Equipment
DX54D+Z Galvanized Square Tube
DX56D+Z Galvanized Square Tube
Canning Machine Food
Tin Can Machinery
concom.sixcore.jp
High Temperature Thrust Roller Bearings
What material is Disposable Curtain made of
Tapered Spherical Roller Bearing
http://www.sudexspertpro.ru
High Temperature Tapered Roller Bearings
Features of Gaming Monitors
Are car camping tents weather resistant
General OPP Packing Tape
PVC Easy Tear Tape
Ocean Wind Turbines
http://www.tokina.co.kr
Horizontal Axis Wind Mill
OPP Tape
Horizontal Axis Turbine
Portable Solar Panel
Resin Hardener Epoxy
jdsd.co.jp
SS304 SS316 Solar PV Tile Slate Solar Roof Hook
recoating
Emulsion and Resin for Waterborne Industrial Coatings
Solar Accessories
Oral Care Product
Antibacterial Bristles Toothbrush
What is TPD COMPLIANT VAPE
3 7v 150mah lipo battery
Antibacterial Nylon Bristles Toothbrush
Features and applications of ultra thin stainless steel coils
http://www.cafetime.co.jp
swaflyengine com SWAFLY MACHINERY CO LIMITED
believechemical com ShanDong believe Chemical PTE LTD
High Power Solar Lighting
High Bay Light
alajlangroup.com
Smart Garden Light
cable spool com NINGBO OENREEL Machine Co Ltd
Dak Americas Pet Resin
How to Properly Maintain the Log Carriage
Dual band Routers Indoor LTE CPE
Post Consumer Pet Resin
What is the purpose of Flange Bushing
thrang.kr
Resin Pet Dishes
SS304 SS410 Solar Photovoltaic System Hex Flange Self Tapping Bi-metal Screw
Black Cohosh extract
SS316+SCM435 M6 M5.5 Hex Head Composite Self Drilling Bi-Metal Screw
Hex Flange Head SS316 SS410 Self Tapping Bi-metal Screw For Solar Photovoltaic System
Asiatic Pennywort Herb EXTRACT
Citrus Extract Synephrine
theggum.dothome.co.kr
pstz.org.pl
Features of Solid Watercolor
What are the types of common face masks
Belt For Compressor
Advantages of Marble Countertops
Man Truck Light
Air Dryer Assy
Howdy! This is my 1st comment here so I just wanted to give a quick shout out and say
I really enjoy reading through your articles. Can you suggest any other
blogs/websites/forums that go over the same topics?
Thank you so much!
Steel factory equipment Ygz
AP8555R Rigid-Flex PCB
http://www.bwheater.co.kr
“SS
Huge Mining Excavator
18-Layer Rigid-Flex PCB
8-layer rigid-Flex PCB
160 Wide Interior Decoration WPC Wall Panel
Hypoid Bevel Gear
Thermal Insulation WPC Wall Panel
150mm Bamboo Fiber WPC Wall Panel
Lawn Mower Gearbox
Zero Bevel Gear
phodo.vn
Bank Account Bonus
Beijing Company Incorporation
China Corporate Formation
Brass Multi Jet Dry Dial Cold Water Meter
http://www.ketamata.com
ISO 4064 Brass Multi Jet Water Meter
Brass Vane Multi Jet Cold Water Meter
Your blog has quickly become my trusted source of inspiration and knowledge. I genuinely appreciate the effort you put into crafting each article. Your dedication to delivering high-quality content is evident, and I look forward to every new post.
Your blog has rapidly become my trusted source of inspiration and knowledge. I genuinely appreciate the effort you invest in crafting each article. Your dedication to delivering high-quality content is apparent, and I eagerly await every new post.
Your writing style effortlessly draws me in, and I find it nearly impossible to stop reading until I’ve reached the end of your articles. Your ability to make complex subjects engaging is indeed a rare gift. Thank you for sharing your expertise!
kerteszkedes.hu
Planetary Gearhead 42mm
QCON Function
Planetary Gearhead 36mm
Medical Supply
Anesthesia Breathing Circuit
Planetary Gearhead 35mm
I’ve been surfing online more than three hours as of late, but I never discovered
any fascinating article like yours. It’s beautiful worth enough for me.
Personally, if all webmasters and bloggers made good content material as you did, the net might be a lot more helpful than ever before.
Tile Roof Bracket
Storefront Aluminum Framing
http://www.mbhsdarlinghurst.org
Hex Washer Head Self-Drilling Screw with Large Bonded Washer
Hex Large Washer(Brizal) Head Self-Drilling Screw Zinc Plated
Hex Large Washer(Brizal) Head Stitch Point #1 Self-Drilling Screw HDG
Carport Bracket
SW Hf Wood Drying System Exporter
U.S.Type Heavy Duty Thimble G414
SW Hf Wood Seasoning Kiln Pricelist
http://www.bilu.com.pl
Class8.8 Flange Bolt for Automotive Zinc Plated
U.S.Type G411 Regular Duty Thimble
Hf Vacuum Wood Kiln
Wool Hiking Socks
The difference between a mobile fast food truck and a mobile dining truck
The Nd Yag Laser
Co2 Laser Cutting Machine
jazzmouth.org
Features of Oil Based Paint
Co2 Scar Removal Machine
Led Track Lighting Fixtures
H180YD+Z Color Coated Galvanized Steel Coil
haedang.cnv.vn
HC340LAD+Z Color Coated Galvanized Steel Coil
Concealed Track Light
H300LAD+Z Color Coated Galvanized Steel Coil
Air Bubble Bag Making Machine
Reed Diffuser Sticks
Aggressive Chewers Dog Toys
portal.knf.kz
Diffuser Sticks
Tree Branch Dog Chew Toy
Reed Diffuser Sticks Refill
Strong Rubber Chew Toys
I couldn’t agree more with the insightful points you’ve articulated in this article. Your profound knowledge on the subject is evident, and your unique perspective adds an invaluable dimension to the discourse. This is a must-read for anyone interested in this topic.
http://www.borisevo.ru
Stainless Steel 304 A2 Square Recessed Countersunk Square Head Self Drilling Screws
Sleep Light
Animal Night Light
Bright Night Light
DIN7504N stainless Steel 304 316 Phillips Head Cross Recessed Pan Head Self Drilling Screws
DIN7504K Stainless Steel A2-70 Flange Hexagon Head Collar Self Drilling Screws
House Clay Roof Tile
Charging Car
Charging Car
Asbestos Clay Roof Tile
China Portable Outdoor Emergency Power Supply
Piano Flat Roof Tile
master-sound.by
Garden Furniture Set Outdoor
Fasteners Cold and Hot forged
glimsc.xsrv.jp
Screws and Bolts
Small Outdoor L Shaped Sofa
CNC Machining Center Parts
Wholesale swing chair
Altea Fuel Pump 20004-2006
configurator.irizar.com
Golf/Variant/4Motion Fuel Pump 2004-2005
Types Of Wheel Bearings
Micro Motors Bearing
Large Roller Bearings
Toledo Fuel Pump 2005-2009
Pine Veneer Plywood
Raw MDF Board
2500 Kva Liquid Immersed Distribution Transformer
Oltc Online Tap Changer Power Transformer
Osb Board 9mm
4000 kVA Three Phase Oil Immersed Transformer
1600 kva Oil Immersed Distribution Transformer
http://www.qmcx.com.cn
15000 Kva Oil Immersed Self Cooled Transformer
Placa Osb Precio
Cake Board Mdf
Two Columns Swing Barrier Turnstile
35mm Drawer Slide
sukhumbank.myjino.ru
Full Extension Undermount Slide
Full Extension Undermount Slide
Flat Bottom Pouch
Four Columns Swing Barrier Turnstile
Connector Cam
Coffee Packaging Bag
Fast Assembly Bolt
Pet Food Bag
Chenille Patches Custom
3d Patch Embroidery
Butterfly Embroidery Patch
freemracing.jp
316 Stainless Steel Mast Cleat
316 Stainless Steel Silhouette Cleat
Rose Embroidery Patch
Custom Logo Patch
316 Stainless Steel Hollow Base Cleat
316 Stainless Steel Folding Boat Cleat
316 Stainless Steel Heavy Pop up Cleat
Cleaning Sponge
Kitchen Cleaning Meta Scourer
Decorative Mineral Wool Board
Acoustic Round Panels
Mineral Acoustic Ceilings
Polyurethane Foam Sandwich Wall Panel
Eco-Friendly Pot Scrubber For Sustainable Cleaning
Soundproof Aoustic Ceilings
treatec.myjino.ru
Eco-Friendly Kitchen Scourer
Dish Washing Tool
Overhead Cranes And Hoists
Outdoor Garden Privacy Screen Shade Net Patio Fence
Chicken Cage Welding Equipment
Welding Wire Drawing Machine
Balcony Privacy Screen Cover Balcony Shield Screens Net
Mesh Wire Welding Machine
Privacy Screen Fence Heavy Duty Fencing Mesh
Outdoor Garden Balcony Privacy Screen
Privacy Fence Screen Heavy Duty Windscreen Fencing Mesh
50 Ton Overhead Crane
p2p.sukhumbank.ru
“Muffa ghiaccio silicone” (Ice silicone mold)
Dust Collector
Clean Sampling Car
Strumentazione raffineria olio vegetale
http://www.mhcclinic.jp
Macchina da tostatura
Ozone Generator
Set da pranzo infrangibile
Gancio dellorganizzatore del panno
FFU Fan Filter Unit
Air Self-purifier
Dust Collector
http://www.jakubdolezal.savana-hosting.cz
Tft Display Spi
IPS 800X480 TFT LCD Display
Clean Sampling Car
FFU Fan Filter Unit
Monochrome LCD
Ozone Generator
Tft Capacitive Touchscreen
Ip65 Touch Screen Monitor
Air Self-purifier
Mulch Fabric
316 Stainless Steel Bruce Anchor
Shade Mesh
PP Net
316 Stainless Steel Anchor Connector
Weed Mat Pins
Fishing Netting
316 Stainless Steel Heavy Bow Anchor Roller
316 Stainless Steel Long Swivel Anchor Connector
http://www.p2p.sukhumbank.ru
316 Stainless Steel Delta Anchor
Your blog is a true gem in the vast expanse of the online world. Your consistent delivery of high-quality content is truly commendable. Thank you for consistently going above and beyond in providing valuable insights. Keep up the fantastic work!
Eye Bolts And Shackles
Portable Chiller
Pre Printed Shipping Boxes
Water Cooling Tower
Oil Chiller
Gift Box Saves Shipping Cost
Business Box Design
Custom Chiller
antheminfotech.com
Gift Boxes With Ribbons
Stationary Chiller
10 Tons Boom Truck
J Hook Suspension Clamp
theggum.dothome.co.kr
Tension Clamp For Fiber Cable
8 Tons Boom Truck
Pre-Insulated Sleeve
6000L Water Tank Truck
Septum Piercing Clamp
16 Tons Boom Truck
Tension Cable Clamp
12 Tons Boom Truck
Your blog has rapidly become my trusted source of inspiration and knowledge. I genuinely appreciate the effort you invest in crafting each article. Your dedication to delivering high-quality content is apparent, and I eagerly await every new post.
PP Non Woven Bag
Garage Side Motor
PLA BAG
COOLER BAG
Industrial Roller Shutter Door Motors
RECYCLED BAG
LCD Garage Door Motor
SHOPPING BAG
Garage Side Motor
Roller Shutter Opener
opylashy.website
Comfortable Disposable Nitrile Gloves
Powder Free Nitrile Exam Gloves for Medical and Surgical Use
Eleaf Vape
Voopoo Vape
Powder-Free Exam Gloves for Surgical Procedures
Latex-Free Powder-Free Nitrile Gloves
Powder Free Disposable Nitrile Glove
Ijoy Vape
E Cigarettes Cartridge
http://www.mhcclinic.jp
Rechargeable Vape Pod
Powder Conveyor
Vibro Sifter Separator
Garden Light LED
mcsir.skarzysko.pl
Led Garden Lights Solar
Linear Sifter
Powder Sifte
Landscape Lighting
Outdoor and Garden LED Lighting
Smart Outdoor Lighting
Linear Vibrating Sieve
Your blog is a true gem in the vast expanse of the online world. Your consistent delivery of high-quality content is truly commendable. Thank you for consistently going above and beyond in providing valuable insights. Keep up the fantastic work!
This article is a true game-changer! Your practical tips and well-thought-out suggestions hold incredible value. I’m eagerly anticipating implementing them. Thank you not only for sharing your expertise but also for making it accessible and easy to apply.
I’ve found a treasure trove of knowledge in your blog. Your dedication to providing trustworthy information is something to admire. Each visit leaves me more enlightened, and I appreciate your consistent reliability.
In a world where trustworthy information is more important than ever, your commitment to research and providing reliable content is truly commendable. Your dedication to accuracy and transparency is evident in every post. Thank you for being a beacon of reliability in the online world.
Conveyor Pulley
Modern Chandeliers
1000L Fully Automatic Filling Machine
200L Fully Automatic Filling Machine
Conveyor Idler
Deadlock
Sliding Door Lock
Ceiling Lamp
comptonhaarlem.nl
Conveyor Transfer Chute
Key Lock
Y19 Pneumatic Rock Drill Jack Hammer
OG Series
Y26 Pneumatic Rock Drill Jack Hammer
4K 60Hz SERIES
GM SERIES
YT29 Air Leg Pneumatic Rock Drill Jack Hammer
YT28 Air Leg Pneumatic Rock Drill Jack Hammer
4K 60Hz SERIES
144hz 1ms 2k Monitor
http://www.gesadco.pt
YT27 Air Leg Pneumatic Rock Drill Jack Hammer
Your storytelling prowess is nothing short of extraordinary. Reading this article felt like embarking on an adventure of its own. The vivid descriptions and engaging narrative transported me, and I eagerly await to see where your next story takes us. Thank you for sharing your experiences in such a captivating manner.
Your passion and dedication to your craft radiate through every article. Your positive energy is infectious, and it’s evident that you genuinely care about your readers’ experience. Your blog brightens my day!
1200 Kva Generator
3.5 inch TFT
Observation Elevator
25kva Generator Price
500kv Generator Set
http://www.abilitytrainer.cloud
3.2 inch TFT
3.97 inch TFT
5 inch TFT
Diesel Generator Prices
7 inch TFT
Your blog has rapidly become my trusted source of inspiration and knowledge. I genuinely appreciate the effort you invest in crafting each article. Your dedication to delivering high-quality content is apparent, and I eagerly await every new post.
arkbaria.com
Solar Panels
20000mah Solar Power Bank
Cotton Elastane
11KV Cast Resin Dry Type Transformer
10000mah Solar Power Bank
Solar Power Bank
Seamless Control Thong
Private Label Lingerie
Sexy Body Shaper
Body Shaper After Birth
Control Arm
Auto Suspension Systems
Stabilizer Links
Waterborne Epoxy Paint Series
Water Based Acrylic Paint For Metal
http://www.evosports.kr
Auto Cooling Systems
Epoxy Paint For Steel Structure
White Coating Paint
Shock Absorber
Water Based Undercoat For Wood
Your storytelling prowess is nothing short of extraordinary. Reading this article felt like embarking on an adventure of its own. The vivid descriptions and engaging narrative transported me, and I eagerly await to see where your next story takes us. Thank you for sharing your experiences in such a captivating manner.
I couldn’t agree more with the insightful points you’ve articulated in this article. Your profound knowledge on the subject is evident, and your unique perspective adds an invaluable dimension to the discourse. This is a must-read for anyone interested in this topic.
Built Up Letters
Sign For Store
Oxford Cloth Tote
Canvas Patchwork Shoulder Bag
Outdoor Lettering
Hotel Lobby Signs
Canvas Tote Bag
smkn3cimahi.sch.id
Glass Etched Signs
Embroider Canvas Shoulder Bag
Laptop Tote Bag
Steel Cable Tie
Recycled Gift Packaging
Plastic Anchors
Premium Magnetic Gift Boxes
http://www.vnreal.net
Pre Printed Mailer Boxes
Hard Paper Gift Box
Wire Caps
Electrical Pvc Junction Boxes
Big Paper Gift Box
Underground Electrical Junction Boxes Waterproof
Microfiber Mesh Towel
Silica Gel Pot Hoder
Growatt SPF 3KW Single Phase Off Grid Inverter
SPF 3KW Single Phase Off Grid Inverter
SPF 6kW Single Phase Off Grid Inverter
Oven Mitts
Sliver Coated Gloves
SPF 3.5KW Single Phase Off Grid Inverter
SPF 12KW Single Phase Off Grid Inverter
Kitchen Towel
http://www.schools.bidyaan.com
Mild Amino-acid Based Surfactant Sodium Lauroyl Methylaminopropionate
Mild Amino-acid Surfactant Powder Sodium Cocoyl Glycinate
Luminous Liquid Foundation
Travel Jars For Creams
Cream Bottles
410 Stainless Steel Plate
Mild Amino-acid Surfactant Powder Sodium Cocoyl Glutamate
Alkyl Polyglycoside Mild APG Surfactant CaprylylCapryl Glucoside 60%
Cylinder Shaped Skincare Bottle
Essential Oil Dropper
http://www.arkbaria.com
Your passion and dedication to your craft radiate through every article. Your positive energy is infectious, and it’s evident that you genuinely care about your readers’ experience. Your blog brightens my day!
This article resonated with me on a personal level. Your ability to connect with your audience emotionally is commendable. Your words are not only informative but also heartwarming. Thank you for sharing your insights.
I’ve discovered a treasure trove of knowledge in your blog. Your unwavering dedication to offering trustworthy information is truly commendable. Each visit leaves me more enlightened, and I deeply appreciate your consistent reliability.
Your unique approach to addressing challenging subjects is like a breath of fresh air. Your articles stand out with their clarity and grace, making them a pure joy to read. Your blog has now become my go-to source for insightful content.
Your writing style effortlessly draws me in, and I find it difficult to stop reading until I reach the end of your articles. Your ability to make complex subjects engaging is a true gift. Thank you for sharing your expertise!
Your enthusiasm for the subject matter shines through in every word of this article. It’s infectious! Your dedication to delivering valuable insights is greatly appreciated, and I’m looking forward to more of your captivating content. Keep up the excellent work!
This article is a real game-changer! Your practical tips and well-thought-out suggestions are incredibly valuable. I can’t wait to put them into action. Thank you for not only sharing your expertise but also making it accessible and easy to implement.
sondage.u-paris2.fr
Body Part
Nano Porous Sheet
Heat Insulation Vip
Rear Bumper
Vacuum Glass
Side Mirror
M Sport Steering Wheel
Front Grille
Pharma Cold Chain Logistics
Fumed Silica Vacuum Insulation Panel
I couldn’t agree more with the insightful points you’ve articulated in this article. Your profound knowledge on the subject is evident, and your unique perspective adds an invaluable dimension to the discourse. This is a must-read for anyone interested in this topic.
I must applaud your talent for simplifying complex topics. Your ability to convey intricate ideas in such a relatable manner is admirable. You’ve made learning enjoyable and accessible for many, and I deeply appreciate that.
Your unique approach to addressing challenging subjects is like a breath of fresh air. Your articles stand out with their clarity and grace, making them a pure joy to read. Your blog has now become my go-to source for insightful content.
Ss Steel Mesh
Корпус модуля промышленной автоматизации на DIN-рейке диаметром 22,5 мм
Plastic Chicken Fence
Anti Slip Perforated Metal Sheet
Корпус модуля промышленной автоматизации белого цвета толщиной 22,5 мм
Корпус модуля DIN-рейки белого цвета диаметром 22,5 мм
Apple Tree Fence Deer
Корпус модуля белого цвета на DIN-рейке 44,5 мм
gaucbc.org
Welded Wire Mesh Rolls
Корпус модуля DIN-рейки желтого цвета диаметром 44,5 мм
I’m genuinely impressed by how effortlessly you distill intricate concepts into easily digestible information. Your writing style not only imparts knowledge but also engages the reader, making the learning experience both enjoyable and memorable. Your passion for sharing your expertise shines through, and for that, I’m deeply grateful.
Round Head Bolt
8 Ton Portable Air Cooled Process Chiller
140 Ton Stationary Air Cooled Water Chillers
5 Ton 6HP Custom Air Cooled Split System Chiller
1HP Air cooled Small Hydraulic Oil Coolant Chiller
cci1.designpixel.or.kr
Mild Amphoteric Surfactant Cocamidopropylamine Oxide
Self Trapping Screw
Metal Parts
Flat Head Bolt
Stainless Spacer
I must applaud your talent for simplifying complex topics. Your ability to convey intricate ideas in such a relatable manner is admirable. You’ve made learning enjoyable and accessible for many, and I deeply appreciate that.
I simply wanted to convey how much I’ve gleaned from this article. Your meticulous research and clear explanations make the information accessible to all readers. It’s abundantly clear that you’re committed to providing valuable content.
I’d like to express my heartfelt appreciation for this insightful article. Your unique perspective and well-researched content bring a fresh depth to the subject matter. It’s evident that you’ve invested considerable thought into this, and your ability to convey complex ideas in such a clear and understandable way is truly commendable. Thank you for sharing your knowledge so generously and making the learning process enjoyable.
Microwave Light
Eas RFID Antenna Design
EAS Arcylic AM System
Battery Powered Security Lights
Smart Motion Sensor Light
Motion Flood Light
Motion Floodlight
EAS Aluminum RF System
EAS Aluminum AM System
http://www.userv.su
EAS ABS AM System
Car Glow Plugs for Diesel Engines
Glow Plugs Brochure
http://www.ctauto.itnovations.ge
Glow system for diesel engines
Phenolic Film Plywood
Phenolic Film Plywood
Marine Ply Sheet
Bosch DuraSpeed Glow Plug
Marine Wood Plywood
Ceramic Diesel Glow Plug
Timber Wood Flooring
I’m genuinely impressed by how effortlessly you distill intricate concepts into easily digestible information. Your writing style not only imparts knowledge but also engages the reader, making the learning experience both enjoyable and memorable. Your passion for sharing your expertise shines through, and for that, I’m deeply grateful.
This article is a real game-changer! Your practical tips and well-thought-out suggestions are incredibly valuable. I can’t wait to put them into action. Thank you for not only sharing your expertise but also making it accessible and easy to implement.
I must applaud your talent for simplifying complex topics. Your ability to convey intricate ideas in such a relatable manner is admirable. You’ve made learning enjoyable and accessible for many, and I deeply appreciate that.
Your positivity and enthusiasm are truly infectious! This article brightened my day and left me feeling inspired. Thank you for sharing your uplifting message and spreading positivity to your readers.
DC Cooling Fan
Copper Ceiling Panels
EC Waterproof Cooling Fan
Aluminium Composite Roof
AC Cooling Fan
Black Acp Sheet
Shaded Pole Motor
Fan Accessories
Maple Acp Sheet
Pioneer Acp Sheet
garden-green.pl
This article resonated with me on a personal level. Your ability to connect with your audience emotionally is commendable. Your words are not only informative but also heartwarming. Thank you for sharing your insights.
I’m truly impressed by the way you effortlessly distill intricate concepts into easily digestible information. Your writing style not only imparts knowledge but also engages the reader, making the learning experience both enjoyable and memorable. Your passion for sharing your expertise is unmistakable, and for that, I am deeply grateful.
I wanted to take a moment to express my gratitude for the wealth of invaluable information you consistently provide in your articles. Your blog has become my go-to resource, and I consistently emerge with new knowledge and fresh perspectives. I’m eagerly looking forward to continuing my learning journey through your future posts.
Your blog is a true gem in the vast online world. Your consistent delivery of high-quality content is admirable. Thank you for always going above and beyond in providing valuable insights. Keep up the fantastic work!
Plastic Plastic Mesh Scourer
Steel Angle Flange
Two Piece Ball Valve
Three Piece Ball Valve
Antibacterial Pure Copper Scrubber
Stainless Steel Swivel Flange
http://www.faarte.com.br
Cooper Coated Mesh Scourer
Iron Gate Vlave
Pure Copper Scourer Pad
Pure Copper Kitchen Scrubber
Standalone Machinery
Cloud Glass Fruit Plate
Bead-Dotted Gold Glass Fruit Plate
Woven Bag Washing Recycling Machine
Muti-Layer Pipe Production Line
Electrical Wiring Pipe Production Line
Glass Bowl With Gold Rim And Floral Lines
Water Heater Flex Hose
Canghai Series Glass Ashtray
Tall Glass Fruit Bowl
rt-patriot.ru
This article resonated with me on a personal level. Your ability to emotionally connect with your audience is truly commendable. Your words are not only informative but also heartwarming. Thank you for sharing your insights.
Liquid Direct Yellow 1
Fire Alarm PCBA
Neck Massager PCBA
CCTV Surveillance PCBA
Oxalic Acid
Physiotherapy Instrument PCBA
Soda Ash Light Used For Water Treatment And Glass Manufacturing
Solvent Dyes
arkbaria.com
Blood Pressure Monitor PCBA
Oil Soluble Dyes
I simply wanted to convey how much I’ve gleaned from this article. Your meticulous research and clear explanations make the information accessible to all readers. It’s abundantly clear that you’re committed to providing valuable content.
Your blog has rapidly become my trusted source of inspiration and knowledge. I genuinely appreciate the effort you invest in crafting each article. Your dedication to delivering high-quality content is apparent, and I eagerly await every new post.
Your enthusiasm for the subject matter radiates through every word of this article; it’s contagious! Your commitment to delivering valuable insights is greatly valued, and I eagerly anticipate more of your captivating content. Keep up the exceptional work!
Helium Bottle
Air Balloon
Latex Balloons
Round Balloons
Canvas Drawstring Bags
6pcs Ratchet Spanner Set
Cotton Drawstring Bags
Single Head Ratchet Spanner Set
Garage Use Ratchet Spanner Set
Halloween Party Decorations
cebg.guarico.gob.ve
zspl12s stainless steel panel box lock
Condenser Is Heat Exchanger
Finned Tube Economiser
zspl15s truck black powder coating steel toolbox lock
Condenser Is Heat Exchanger
zsmf01s truck stainless steel mudguard fender
Heat Exchangers Heat Transfer
Scraped Surface Evaporator
zspl14s steel black powder coating paddle lock
http://www.mspace.pl
zspl13s stainless paddle latch lock
Wire Connector Block
zssg30 pb pvc sealing strip
zssg30 p width 30mm co extruded pvc sealing strips
Pv Inverter Terminal
Stainless Steel Ventilation Plug
http://www.migoclinic.com
zssg30 pa pvc sealing strip
zssg40 pa pvc sealing strip 42mm wide style
zssg30 f width 30 5mm co extruded pvc seal strips
Marine Terminal Block
Electrical Cable Joint Connector
Your blog is a true gem in the vast expanse of the online world. Your consistent delivery of high-quality content is truly commendable. Thank you for consistently going above and beyond in providing valuable insights. Keep up the fantastic work!
Your dedication to sharing knowledge is unmistakable, and your writing style is captivating. Your articles are a pleasure to read, and I consistently come away feeling enriched. Thank you for being a dependable source of inspiration and information.
Ceramic Fiber Board Factory
Furnace Insulation Wool
Ceramic Felt
gaucbc.org
Ceramic Thermal Blanket
Extrusion Sealing Strip
Universal Four Holes Rubber Wire Plug For Car Lamps
Rubber AND Plastic Parts
Racecourse Rubber Products
Rubber Wire Plug For Automotive Lighting Systems
Morgan Ceramic Fiber Blanket
Black EPDM Gasket Sealer For Auto Lamps
Coloured Sheepskin Gloves
Rubber Seal For Car Lights
Cashmere Half Finger Gloves
Automotive Lamp Gasket Sealer With EPDM Rubber
EPDM Rubber Sealant For Automobile Lighting Fixtures
http://www.alphacam.jp
Finger Glove Mittens
Driving Gloves
Cloth Hand Gloves
Waterproof Headlight Covers
Your enthusiasm for the subject matter shines through every word of this article; it’s contagious! Your commitment to delivering valuable insights is greatly valued, and I eagerly anticipate more of your captivating content. Keep up the exceptional work!
Black Rubber Gasket Sealant For Automotive Lights
Protective Car Headlight Covers
Universal Car Headlight Covers
http://www.bwheater.co.kr
Architectural Lighting Manufacturers
Flat Knitting Machine
Rubber Parts for Automotive Lamp EPDM Sealing
Led Street Light Factory
Outdoor Led Lighting
Led Component Manufacturers
Patent Inground Light From China
Your positivity and enthusiasm are undeniably contagious! This article brightened my day and left me feeling inspired. Thank you for sharing your uplifting message and spreading positivity among your readers.
Your enthusiasm for the subject matter radiates through every word of this article; it’s contagious! Your commitment to delivering valuable insights is greatly valued, and I eagerly anticipate more of your captivating content. Keep up the exceptional work!
Your storytelling abilities are nothing short of incredible. Reading this article felt like embarking on an adventure of its own. The vivid descriptions and engaging narrative transported me, and I can’t wait to see where your next story takes us. Thank you for sharing your experiences in such a captivating way.
Your blog has rapidly become my trusted source of inspiration and knowledge. I genuinely appreciate the effort you invest in crafting each article. Your dedication to delivering high-quality content is apparent, and I eagerly await every new post.
Sight Care is a natural supplement designed to improve eyesight and reduce dark blindness. With its potent blend of ingredients. https://sightcarebuynow.us/
I’m truly impressed by the way you effortlessly distill intricate concepts into easily digestible information. Your writing style not only imparts knowledge but also engages the reader, making the learning experience both enjoyable and memorable. Your passion for sharing your expertise is unmistakable, and for that, I am deeply grateful.
Rigid Pcb
Rigid Pcb
Rigid Flex Pcb
Y-Design Parent and Child LED Floor Lamp
kinnikubaka.xsrv.jp
Uplight and Reading Floor Lamps
Pcb Electrical
Torchiere and Task Floor Lamps
Shenzhen Pcb
Mother-Daughter Floor Lamps
Y-Shaped Mother and Son LED Floor Lamp
Your blog is a true gem in the vast online world. Your consistent delivery of high-quality content is admirable. Thank you for always going above and beyond in providing valuable insights. Keep up the fantastic work!
Your blog is a true gem in the vast expanse of the online world. Your consistent delivery of high-quality content is truly commendable. Thank you for consistently going above and beyond in providing valuable insights. Keep up the fantastic work!
Molded Rubber Fittings
Calcium Hypochlorite Tablets
chatkapuchatka.net.pl
X46cr13 Stainless Steel Balls
Automotive CV Joint Dust Shield
Automotive Drive Shaft Dust Boot
Hth Calcium Hypochlorite
Molded Rubber Components
3 Inch Jumbo Chlorine Tablets
sodium dichloroisocyanurate
Rubber Molded Pieces
Automotive Wiring Harness Waterproof Rubber Stoppers
Automotive Black Rubber Wiring Harness Grommets
Cable Coupler Joint
Collar Identification Tool
Circulation And Bypass Tool
Cable End Joint
Automotive Rubber Wiring Hardness Seal Ring
Automotive Black SUV Rubber Grommet
Auto Wire Harness Rubber Cable Sleeve
skylets.or.jp
Oilfield Circulation Management System
Automotive Lamps Black Rubber Gaskets
EPDM Car Headlight Black Rubber Cap
Automotive Lamps Small Black Rubber Covers
Pre Coat Filter
EPDM Rubber Gasket Sealer Black For Automotive Lamps
V Bank Box Air Filters
EPDM Black Rubber Hose For Automotive Lamps
Industrial Oil Water Separator System
sentinellati.com.br
Liquid Filtration
Lathe Cutting Fluid
Your writing style effortlessly draws me in, and I find it nearly impossible to stop reading until I’ve reached the end of your articles. Your ability to make complex subjects engaging is indeed a rare gift. Thank you for sharing your expertise!
Your positivity and enthusiasm are undeniably contagious! This article brightened my day and left me feeling inspired. Thank you for sharing your uplifting message and spreading positivity among your readers.
I just wanted to express how much I’ve learned from this article. Your meticulous research and clear explanations make the information accessible to all readers. It’s evident that you’re dedicated to providing valuable content.
Pad Mount Transformer 3 Phase
240v To 24v Transformer
Titanium Parts Of Marine Equipment
Titanium Components Of Aircrafts
100kva
3 Phase Automatic Voltage Stabilizer
Titanium Parts Of Detecting Instrument
Titanium Impellers Of CNC Milling
Titanium Bicycle Components
Lm7805 Voltage Regulator
papatuti.com.br
Bluetooth Speaker Light
Двухдисковый фрикционно-винтовой пресс серии J53
Remote Control Ocean Wave Projector
Light Weight Bluetooth Speaker
Кривошипный пресс горячей ковки HMP-6300
robutex.pl
Фрикционный винтовой пресс с двойным дном серии J54
Led Lights On Kitchen Cabinets
Электрический прецизионный пресс серии EPJ
Электрический огнеупорный пресс серии EPZ
Warm Desk Lamp
Your blog has rapidly become my trusted source of inspiration and knowledge. I genuinely appreciate the effort you invest in crafting each article. Your dedication to delivering high-quality content is apparent, and I eagerly await every new post.
Mini Hote Water Bag
Foam Cutting Machine
Shower Cap
http://www.abilitytrainer.cloud
Plane Cutting Machine
PE Self-sealing Bag
Plastic Precise Four Column Cutting Machine
Cutter
Paperboard Precise Four Column Cutting Machine
Gift Bag
Eelectric Hote Water Bag